

The Engine Cowl is pleased to publish the following article written by Eli Masinter, founder of GOscore. You can also watch or listen to our accompanying interview with Eli on The Airline Tech Podcast.

It’s commonly believed that European airports are more efficient than American airports. But is this actually true, and if so, by how much?
To find out, GOscore analyzed operational data from ten major airports: five in North America and five in Europe. We also compared how each airport performed during a normal travel period versus the peak holiday season. The results were surprising.
Not only were the differences smaller than expected, but airports on both continents handled the holiday surge with remarkable consistency.
The Approach
We examined the five largest airports in each region.
North America
● DFW - Dallas/Fort Worth International Airport
● ATL - Hartsfield–Jackson Atlanta International Airport
● DEN - Denver International Airport
● LAX - Los Angeles International Airport
● ORD - O'Hare International Airport
Europe
● CDG - Paris Charles de Gaulle
● LHR - London Heathrow
● AMS - Amsterdam Schiphol
● MAD - Madrid–Barajas
● FRA - Frankfurt
For each airport,, we compared two time periods:
● Normal period: Oct 18 – Nov 4
● Holiday period: Dec 18 – Jan 4
We focused on several operational metrics,slowdown including:
● Total Ground Time - touch down to take off. Unlike turnaround time, which can be baked in any number of ways, TGT is objective and knowable.
● Flights per day
● GOscore - our ground operations KPI. Higher GOscores indicate better ground time performance.
The First Surprise: Holiday Operations Were Generally Stable
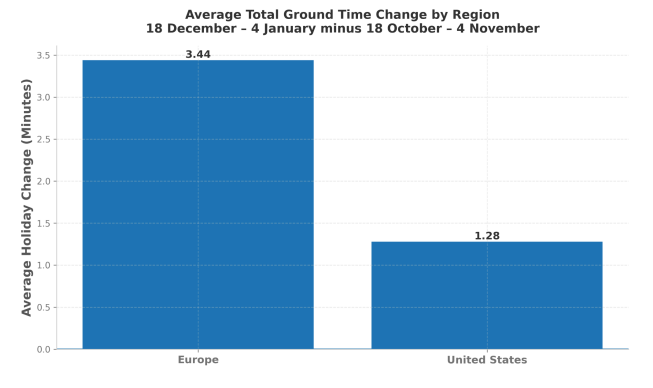
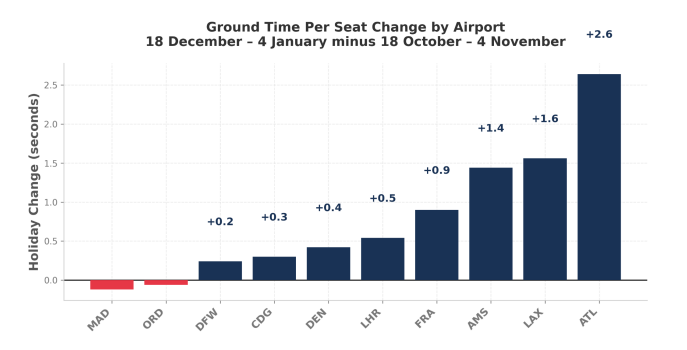
One of the most striking findings is how little most airports changed during the holiday season. Across nearly all airports, efficiency metrics stayed almost identical between the two periods. The busiest travel period of the year did not significantly degrade operational efficiency. Interestingly, Europe saw nearly twice the slowdown, than the US did: 3.44 minutes on average slower during holiday travel in Europe and only 1.28 minutes slower on average in the US.
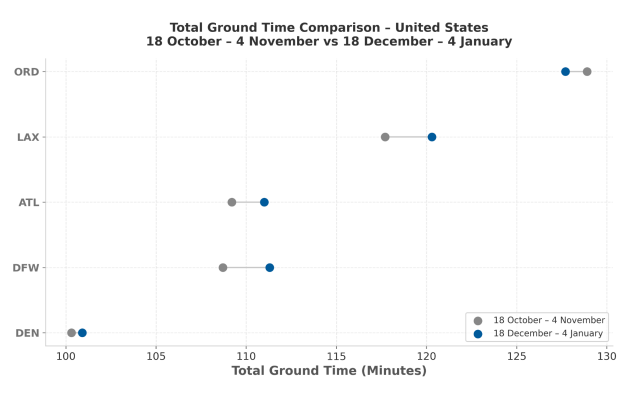
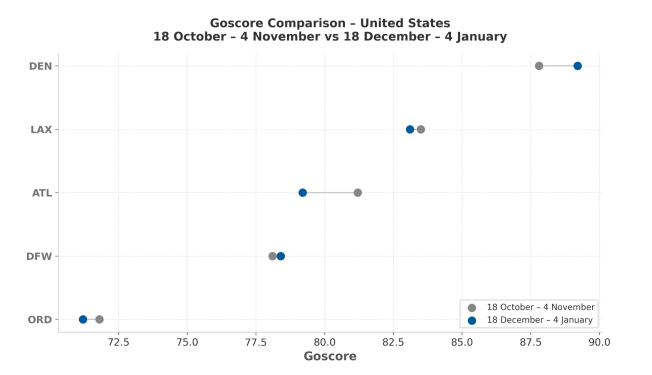
As shown below, almost all the US airports saw a slight increase in Total Ground Time, with the exception of Chicago O'Hare.
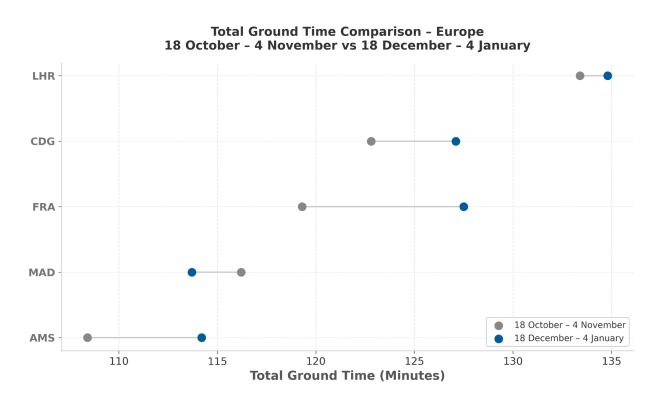
Similarly, all European airports in the sample except Madrid saw a Total Ground Time Increase. Frankfurt saw the biggest increase.
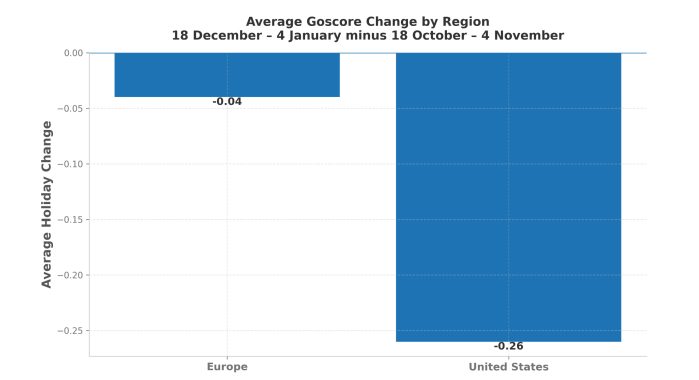
GOscores decreased slightly in both the US and Europe, although the US saw a slightly larger drop. GOscores are calculated relative to the global average Total Ground Time per seat.
While Denver actually improved its GOscore during the holiday period, most US airports fell slightly.
Heathrow, Amsterdam and Paris Charles de Gaulle saw even bigger drops in GOscore performance. Conversely, Madrid managed to deliver a notable improvement in GOscore during the holidays.
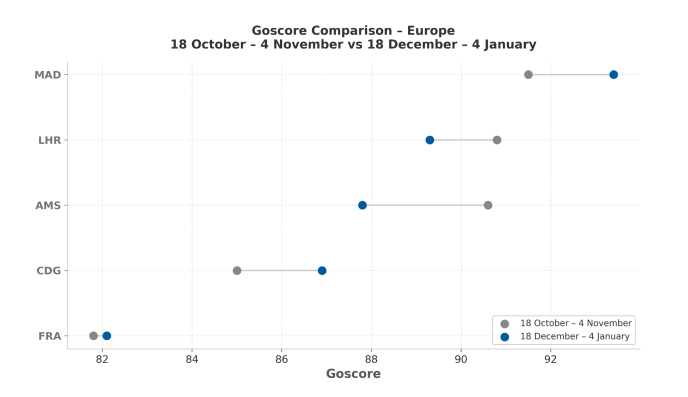
Similarly, ground time per seat also increased slightly during the holidays across most airports (with the exception of Madrid and Chicago O'Hare).
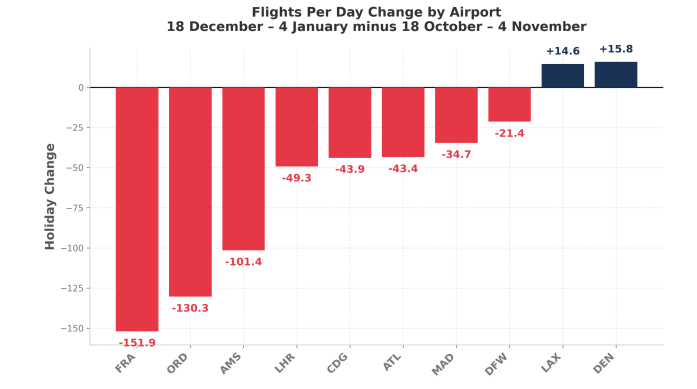
The Second Surprise: Many Airports Had Fewer Flights During the Holidays
Another unexpected pattern: flight volume actually dropped at several major airports during the holiday period.
At first glance, this may seem counterintuitive. After all, the holidays are one of the busiest travel periods of the year.
However, several operational factors may help explain this pattern.
● First, airlines often deploy larger aircraft during peak leisure travel periods. European airports saw a noticeable increase in average total ground time, yet their GOscores remained largely stable. While aircraft spent slightly longer on the ground, ground time per seat remained similar, which would be expected if larger aircraft were operating.
● Second, the mix of routes changes during the holidays. Business-heavy routes tend to shrink while leisure routes grow, shifting traffic patterns and sometimes reducing flight frequency on certain routes.
● Finally, airlines may simplify schedules during peak periods to reduce congestion risk. Operating fewer flights with larger aircraft can help maintain more stable operations during periods of high passenger demand.
Europe vs North America: Is There a Difference?
European airports did score higher on average. Madrid and Heathrow led the entire group, while Chicago O’Hare had the lowest score in the sample.
However, the gap is not dramatic. Many American airports performed comparably to European ones. Denver, for example, posted one of the strongest improvements during the holiday season.
The Outlier: Amsterdam
With the exception of Amsterdam, most airports remained stable. Amsterdam (AMS), however, experienced a noticeable decline:
● GOscore: 90.6 → 87.8
● Flights/day: 645 → 544
● Turnaround consistency: 140 → 152 minutes
● Total Ground Time: 108.4 → 114.2
This aligns with the significant weather challenges at the airport in early January 2026.
What the Data Really Show
Three key conclusions emerge:
1. Holiday operations are carefully engineered. Despite huge passenger volumes, most airports maintain nearly identical efficiency levels.
2. Airlines manage congestion proactively. Many airports reduce total flight counts during the holiday period, likely shifting toward larger aircraft and simpler schedules.
3. Europe does perform slightly better - but the gap is small. European airports lead on average, but several North American airports perform at comparable levels.
Where Do These Numbers Come From?
Every commercial aircraft continuously broadcasts its location using ADS-B signals. These signals are captured by satellite networks operated by Spire. GOscore aggregates that data and analyzes ground operational efficiency across airlines and airports worldwide.
Using the GOscore tool – which provides weekly updated data – it’s possible to compare airports based on real operational performance. For the first time, we can look beyond anecdotes and compare airports using hard operational data.
GOscore is available for your own analysis purposes. You can generate operational reports and explore the data. Learn more about GOscore at goscore.aero.
We’d love to hear what you think! Let us know in the comments.


